Note
Go to the end to download the full example code.
ASW inference - Two pulses model#
This example implements inference for the ASW population under a two pulses model of admixture, using the tracts package. Inference is performed using autosomal and X chromosome data, allowing for the specification of sex-biased admixture.
To implement this example, we use the following driver file:
samples:
  directory: ./TrioPhased/
  individual_names: [
    "NA19625","NA19700","NA19701","NA19703","NA19704","NA19707","NA19711","NA19712","NA19713","NA19818","NA19819",
    "NA19834","NA19835","NA19900","NA19901","NA19904","NA19908","NA19909","NA19913","NA19914","NA19916","NA19917",
    "NA19920","NA19921","NA19922","NA19923","NA19982","NA19984","NA20126","NA20127","NA20274","NA20276","NA20278",
    "NA20281","NA20282","NA20287","NA20289","NA20291","NA20294","NA20296","NA20298","NA20299","NA20314","NA20317",
    "NA20318","NA20320","NA20321","NA20332","NA20334","NA20339","NA20340","NA20342","NA20346","NA20348","NA20351",
    "NA20355","NA20356","NA20357","NA20359","NA20362","NA20412"]
  male_names : [
    "NA19700","NA19703","NA19711","NA19818","NA19834","NA19900","NA19904","NA19908","NA19916","NA19920",
    "NA19922","NA19982","NA19984","NA20126","NA20278","NA20281","NA20291","NA20298","NA20318","NA20340",
    "NA20342","NA20346","NA20348","NA20351","NA20356","NA20362"] #see Readme_dataprocessing.md for how this was generated
  filename_format: "{name}_{label}_final.bed"
  labels: [A, B] #If this field is omitted, 'A' and 'B' will be used by default
  chromosomes: 1-22 #The chromosomes to use for analysis. Can be specified as a list or a range
  allosomes: [X]

output_filename_format: "ASW_test_output_{label}"
log_filename: 'ASW_two_pulses.log'
output_directory: ./output_two_pulses/
verbose_log: 1
verbose_screen: 30
log_scale : True

start_params:
  t1: 10
  REUR: 0.1
  t2: 5
  REUR_sex_bias: 0.01

repetitions: 3
seed: 100
maximum_iterations: 1000
unknown_labels_for_smoothing: ["UNK", "centromere","miscall"] # segments with these labels will be smoother over, that is, will be filled with neighbouring ancestries up to their midpoints.
exclude_tracts_below_cm: 2
npts : 50
#fix_parameters_from_ancestry_proportions: ['REUR2', 'RNAT', 'REUR2_sex_bias', 'RNAT_sex_bias']
output_directory: ./output_two_pulses/
ad_model_autosomes: M
ad_model_allosomes: DC
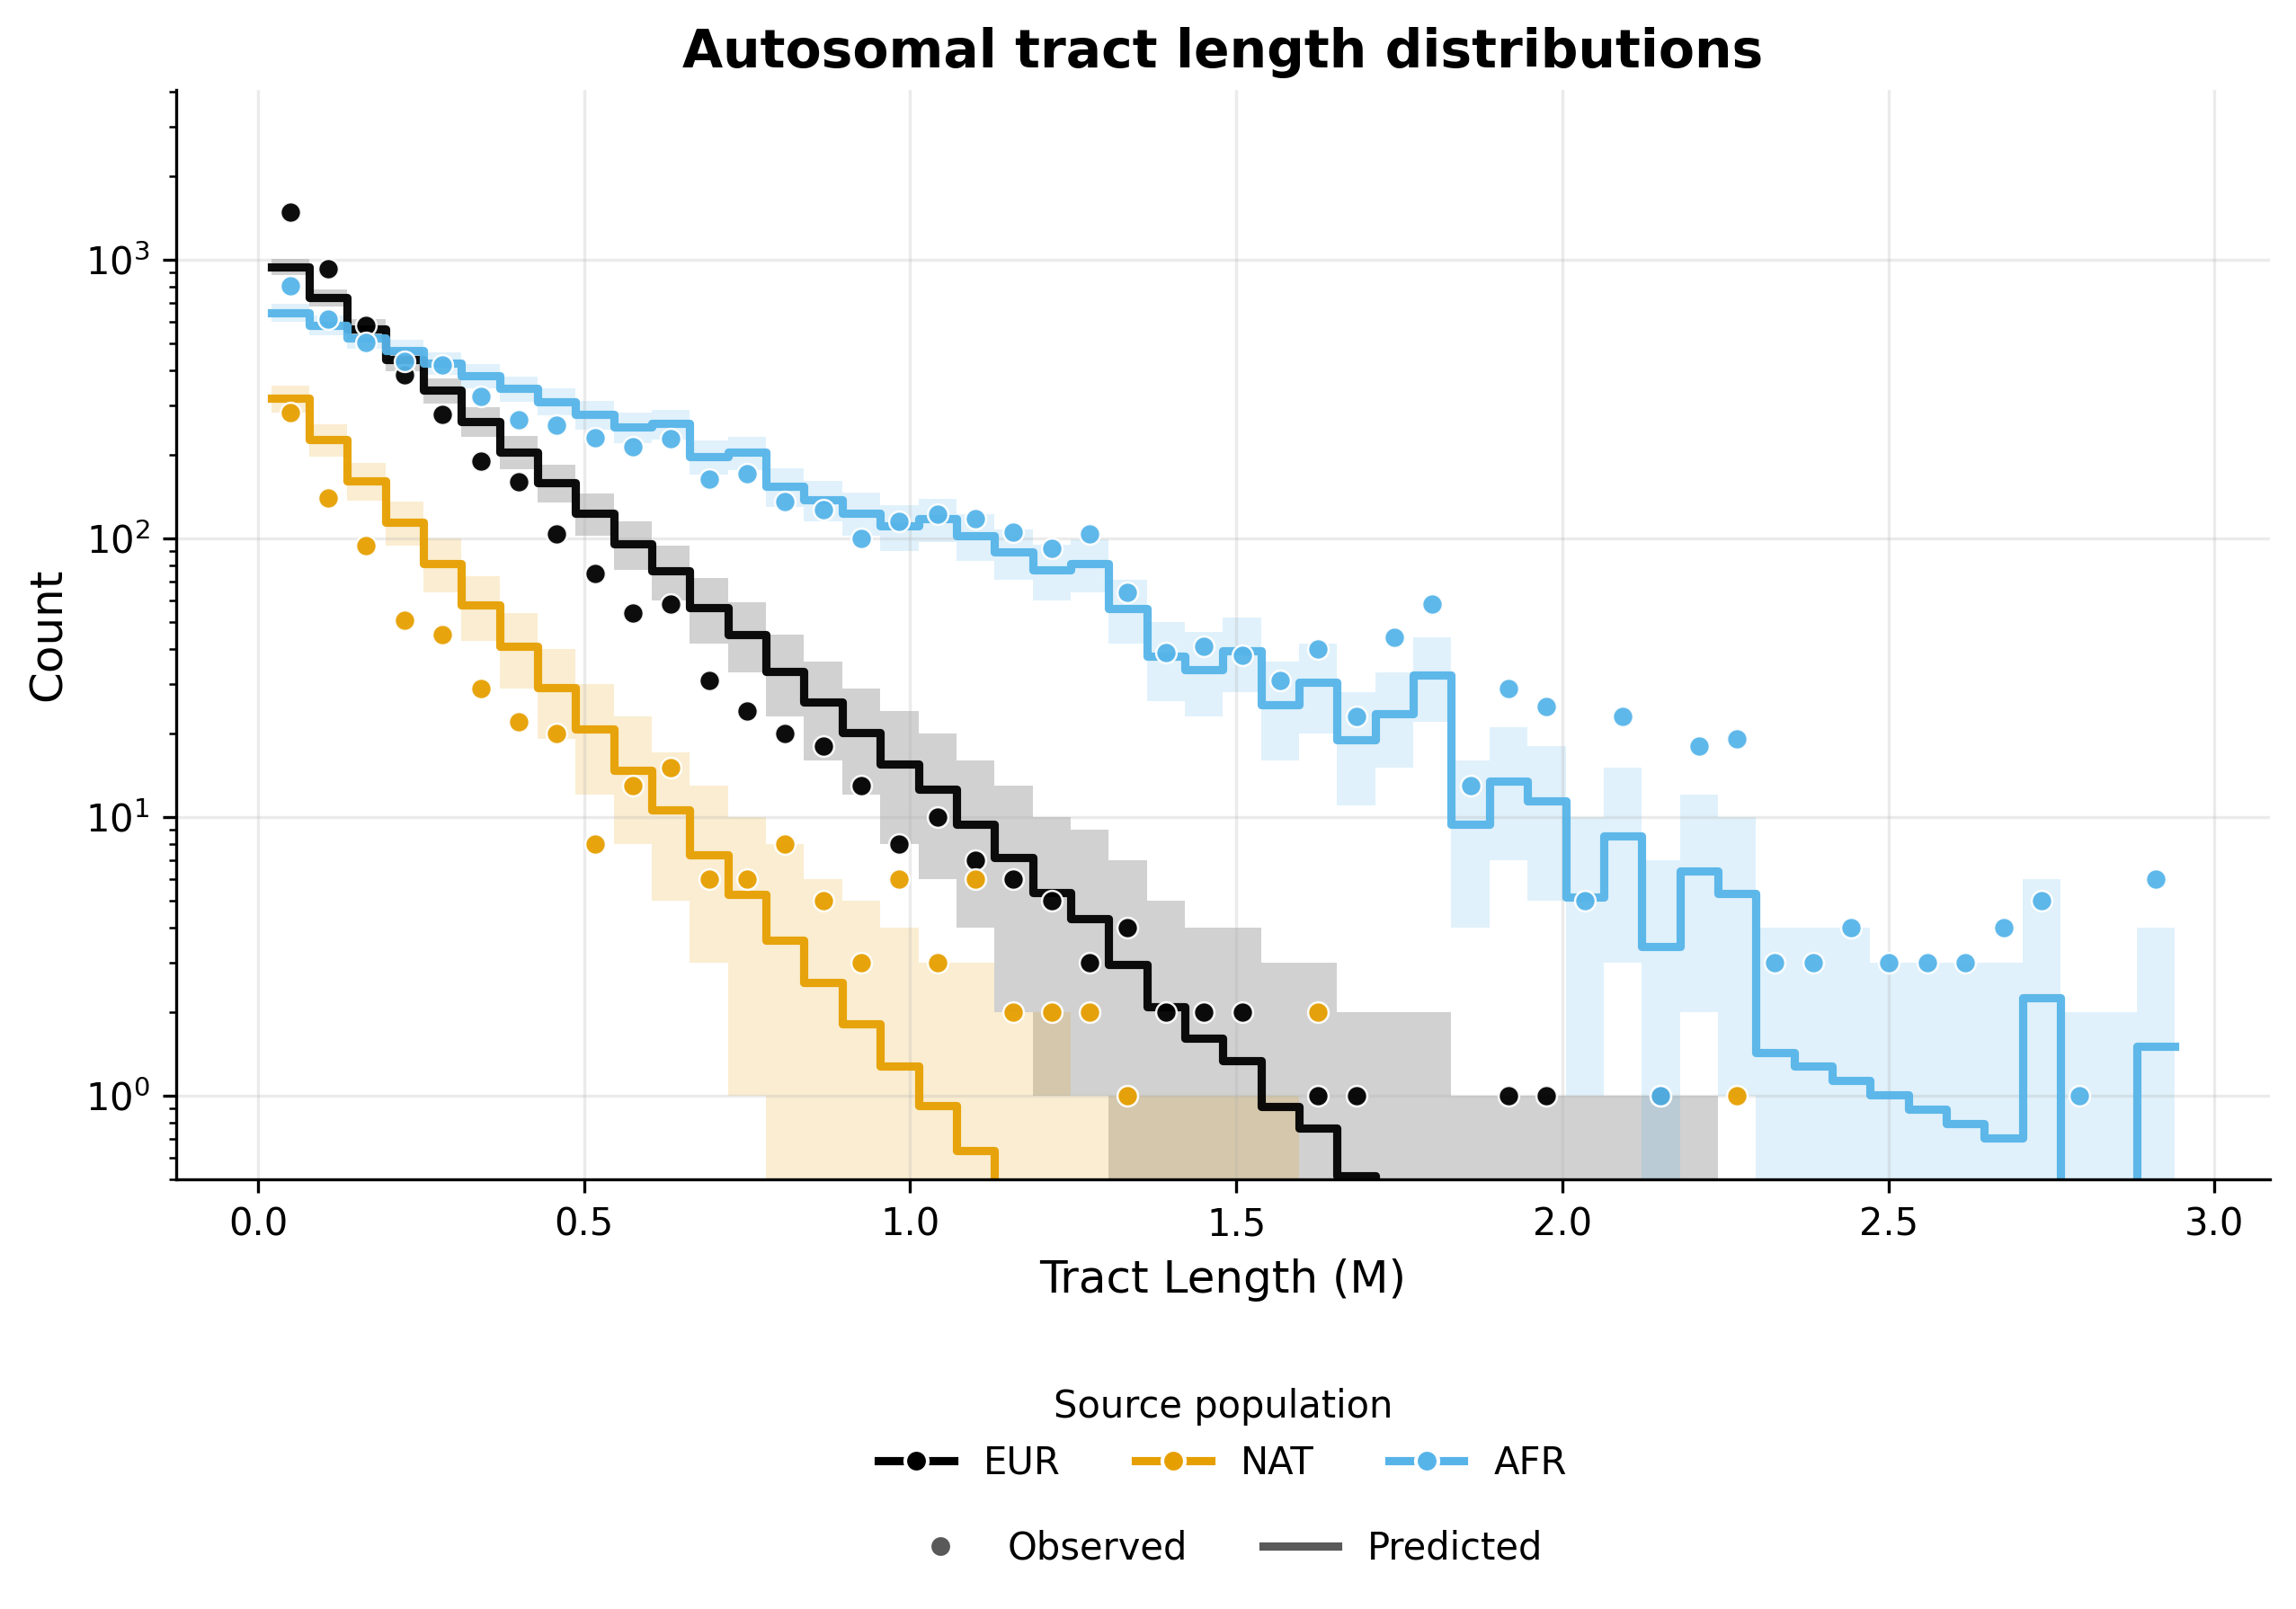
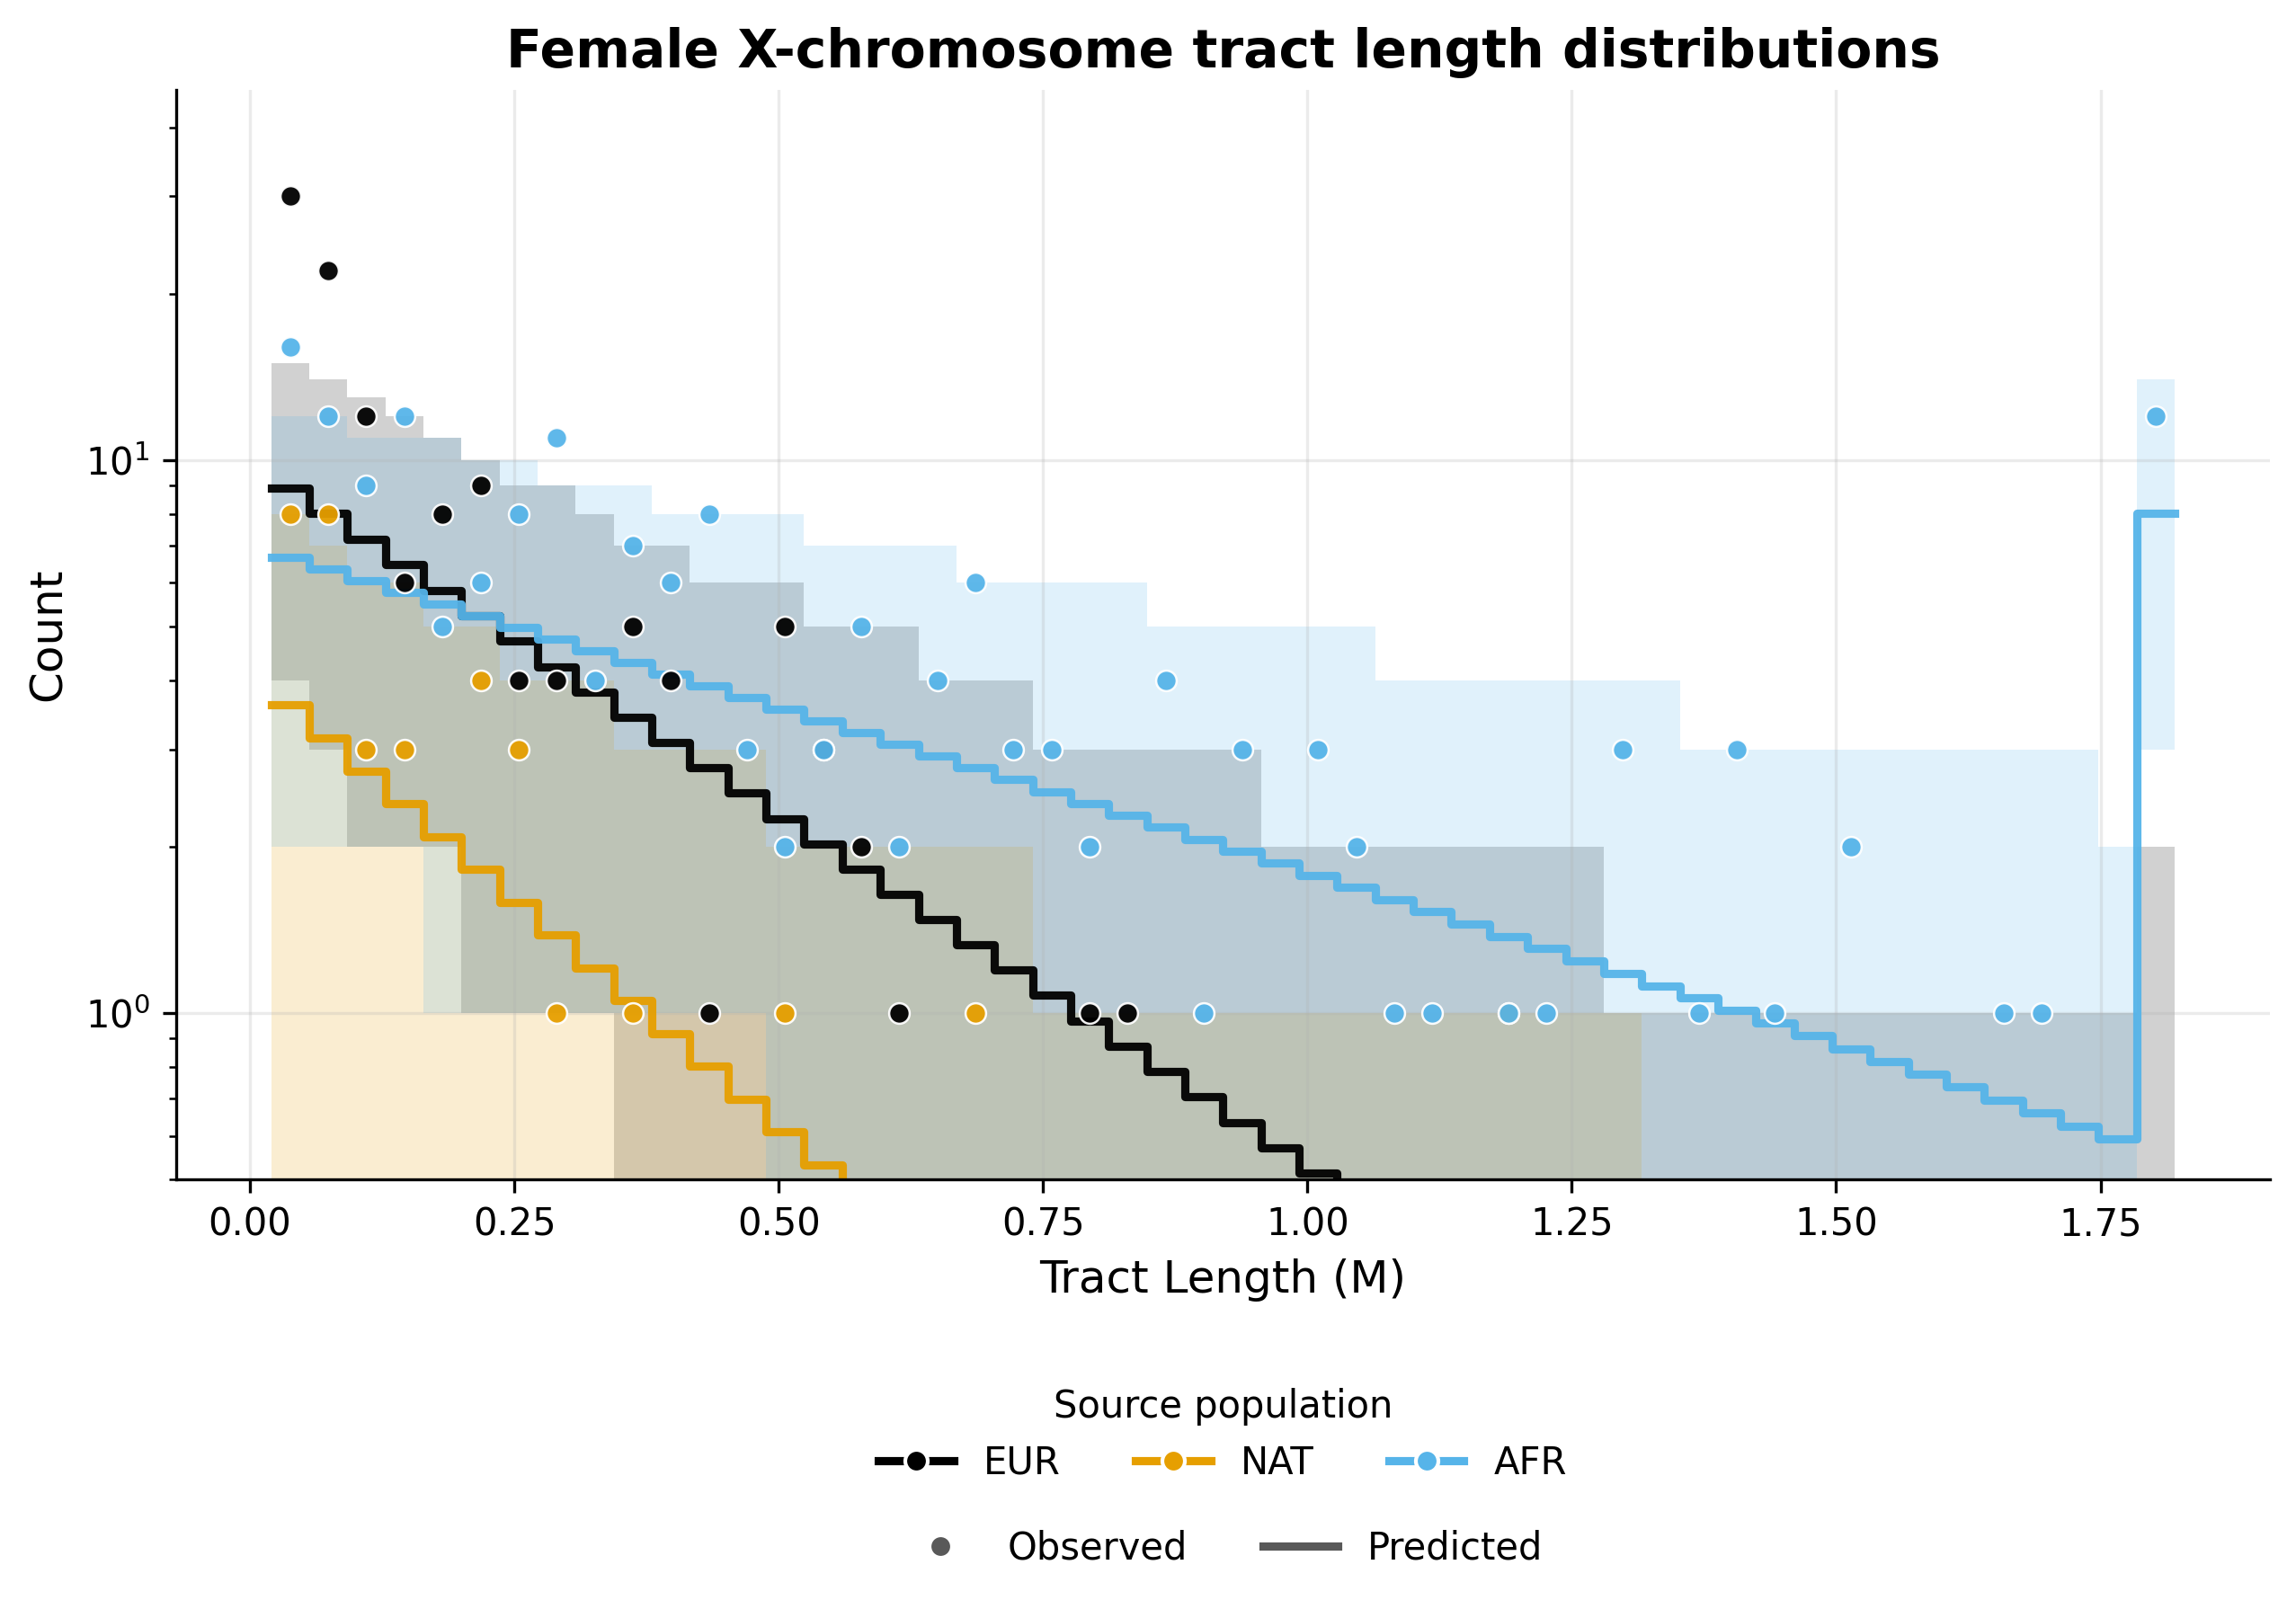
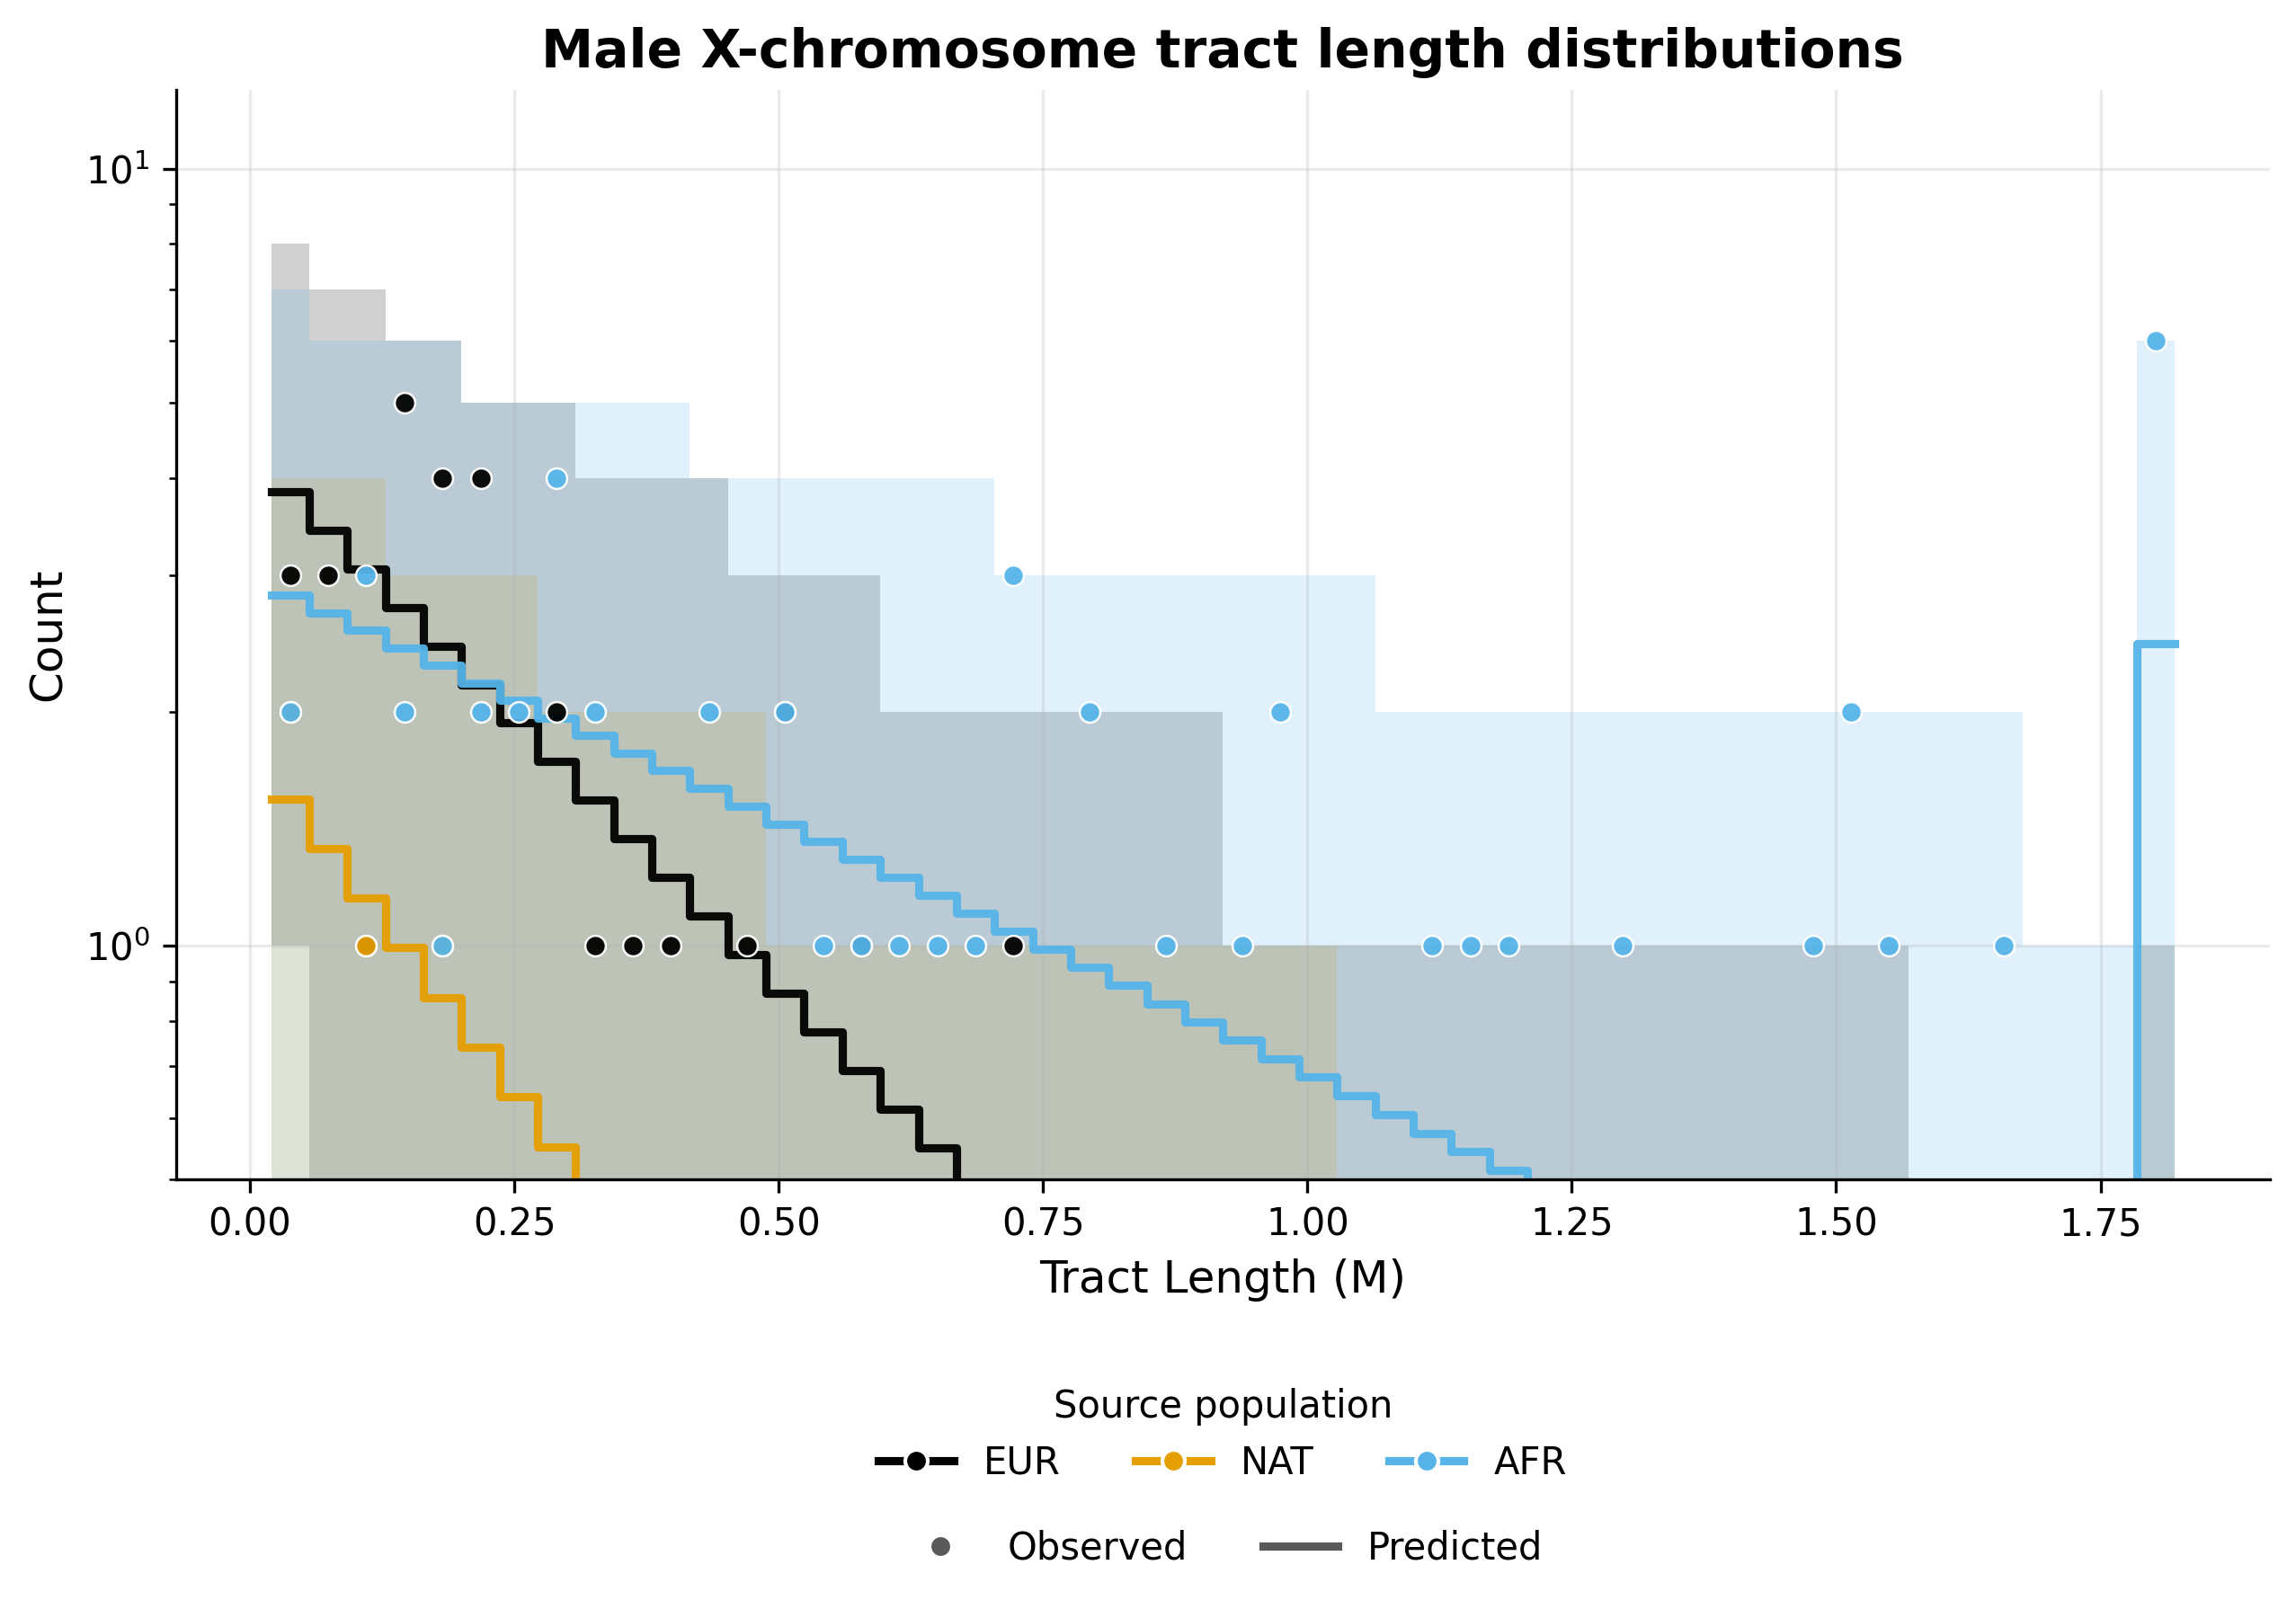
Complete results from this analysis are saved in the output directory specified in the driver file. Below, we display the optimal parameters estimated from this analysis, as well as the plots illustrating the inferred tract length distributions, compared to the observed histograms, for every source population and chromosome type (autosomes and X chromosome).
Optimal parameters#
parameter |
value |
|---|---|
REUR |
0.08468379234797516 |
REUR_sex_bias |
0.9881907963554442 |
RNAT |
0.057042875827893344 |
RNAT_sex_bias |
0.9480132994350583 |
t1 |
6.576740270456071 |
REUR2 |
0.16394017972900624 |
REUR2_sex_bias |
-0.9897010207719934 |
t2 |
5.576083133046345 |
likelihood -1098.9 |
Tract length histograms#
Autosomal admixture#
X chromosome admixture in females#
X chromosome admixture in males#
------------------------------------------------------------------------------------------------

Running tracts 2.0 with driver file: ASW_two_pulses.yaml

------------------------------------------------------------------------------------------------

Results will be written to: output_two_pulses.
Using log file: output_two_pulses/ASW_two_pulses.log.
excluding_tracts_below set to 2.0 cM.
Ancestries: EUR, NAT, AFR
Data autosome proportions: [0.19578862 0.03825495 0.76595643]
Data allosome proportions: [0.16839124 0.03818939 0.79341937]
Model parameters: REUR, REUR_sex_bias, RNAT, RNAT_sex_bias, t1, REUR2, REUR2_sex_bias, t2
Admixture is modelled with the M model for autosomes and with the DC model for allosomes.
Multiple starting parameters will be generated and used for multiple optimization runs.

-----------------------------------------------------------------------------------------------
Step 1 : Optimizing autosomal likelihood over parameters ['REUR', 'RNAT', 't1', 'REUR2', 't2'].
-----------------------------------------------------------------------------------------------
Starting parameters for step 1 optimization
------------------------------------------------------------------------------
Run |         REUR |         RNAT |           t1 |        REUR2 |           t2
------------------------------------------------------------------------------
  1 |          0.1 |          0.1 |        13.89 |          0.2 |        7.641
  2 |          0.1 |          0.1 |        12.52 |          0.2 |        6.141
  3 |          0.1 |          0.1 |        13.99 |          0.2 |        5.288
------------------------------------------------------------------------------

Optimization run #1

Iter.    Log-likelihood  Model parameters        Transmission
-------------------------------------------------------------
30      , -4538.44    , array([ 0.0953582  ,  0          ,  0.0944209  ,  0          ,  11.4738    ,  0.196736   ,  0          ,  7.00516    ]), Autosomes
60      , -2341.91    , array([ 0.0904571  ,  0          ,  0.0871004  ,  0          ,  9.23133    ,  0.188989   ,  0          ,  6.24366    ]), Autosomes
90      , -1227.09    , array([ 0.0878228  ,  0          ,  0.0793795  ,  0          ,  7.36465    ,  0.182499   ,  0          ,  5.68516    ]), Autosomes
120     , -949.427    , array([ 0.0834851  ,  0          ,  0.0735855  ,  0          ,  6.61625    ,  0.175779   ,  0          ,  5.61372    ]), Autosomes
Optimization completed
----------------------

Optimization run #2

Iter.    Log-likelihood  Model parameters        Transmission
-------------------------------------------------------------
30      , -3076.31    , array([ 0.0948264  ,  0          ,  0.0930836  ,  0          ,  10.392     ,  0.19423    ,  0          ,  5.70553    ]), Autosomes
60      , -1587.74    , array([ 0.089653   ,  0          ,  0.0855664  ,  0          ,  8.26067    ,  0.188404   ,  0          ,  5.20647    ]), Autosomes
90      , -1024.42    , array([ 0.0857413  ,  0          ,  0.0741787  ,  0          ,  6.78731    ,  0.17934    ,  0          ,  5.12973    ]), Autosomes
120     , -919.197    , array([ 0.0848331  ,  0          ,  0.0702176  ,  0          ,  6.36681    ,  0.176561   ,  0          ,  5.36338    ]), Autosomes
150     , 4.15817e+27 , array([ 0.084797   ,  0          ,  0.0701599  ,  0          ,  6.36627    ,  0.176477   ,  0          ,  5.36631    ]), OOB (oob=-4.1581650789268565e-05)
Optimization completed
----------------------

Optimization run #3

Iter.    Log-likelihood  Model parameters        Transmission
-------------------------------------------------------------
30      , -3694.51    , array([ 0.0943971  ,  0          ,  0.0919076  ,  0          ,  11.9332    ,  0.197646   ,  0          ,  4.97037    ]), Autosomes
60      , -1895       , array([ 0.0898342  ,  0          ,  0.0830427  ,  0          ,  9.41982    ,  0.193181   ,  0          ,  4.7267     ]), Autosomes
90      , -1207.18    , array([ 0.08665    ,  0          ,  0.0747253  ,  0          ,  7.80178    ,  0.18735    ,  0          ,  4.51408    ]), Autosomes
120     , -973.891    , array([ 0.0856579  ,  0          ,  0.0655613  ,  0          ,  6.99577    ,  0.176278   ,  0          ,  4.78787    ]), Autosomes
150     , -882.714    , array([ 0.0853844  ,  0          ,  0.0617342  ,  0          ,  6.79096    ,  0.169927   ,  0          ,  5.13186    ]), Autosomes
180     , -783.752    , array([ 0.0849452  ,  0          ,  0.0573191  ,  0          ,  6.55847    ,  0.164013   ,  0          ,  5.55773    ]), Autosomes
210     , -780.22     , array([ 0.0846849  ,  0          ,  0.0570419  ,  0          ,  6.57659    ,  0.163945   ,  0          ,  5.57606    ]), Autosomes
Optimization completed
----------------------

Step 1: Results from multiple optimization runs with different starting parameters:
----------------------------------------------------------------------------------------------------------------------------------------------
Run |       LogLik |         REUR | REUR_sex_bias |         RNAT | RNAT_sex_bias |           t1 |        REUR2 | REUR2_sex_bias |           t2
----------------------------------------------------------------------------------------------------------------------------------------------
  1 |     -948.428 |      0.08363 |             0 |      0.07359 |             0 |        6.603 |       0.1757 |              0 |        5.603
  2 |     -918.209 |       0.0848 |             0 |      0.07016 |             0 |        6.366 |       0.1765 |              0 |        5.366
  3 |      -780.22 |      0.08468 |             0 |      0.05704 |             0 |        6.577 |       0.1639 |              0 |        5.576
----------------------------------------------------------------------------------------------------------------------------------------------
Selecting best parameters from step 1 and proceeding to step 2 optimization.

----------------------------------------------------------------------------------------------------------------
Step 2 : Optimizing allosomal likelihood over parameters : ['REUR_sex_bias', 'RNAT_sex_bias', 'REUR2_sex_bias'].
----------------------------------------------------------------------------------------------------------------
Starting parameters for step 2 optimization (non-sex-bias parameters are fixed to the best step 1 estimates).
-------------------------------------------------------------------------------------------------------------------------------
Run |         REUR | REUR_sex_bias |         RNAT | RNAT_sex_bias |           t1 |        REUR2 | REUR2_sex_bias |           t2
-------------------------------------------------------------------------------------------------------------------------------
  1 |      0.08468 |          0.01 |      0.05704 |           0.1 |        6.577 |       0.1639 |            0.1 |        5.576
-------------------------------------------------------------------------------------------------------------------------------

Optimization run #1

Iter.    Log-likelihood  Model parameters        Transmission
-------------------------------------------------------------
30      , -213.552    , array([ 0.0846838  ,  0.100087   ,  0.0570429  ,  0.184035   ,  6.57674    ,  0.16394    ,  0.0493311  ,  5.57608    ]), Female allosomes
30      , -99.8798    , array([ 0.0846838  ,  0.100087   ,  0.0570429  ,  0.184035   ,  6.57674    ,  0.16394    ,  0.0493311  ,  5.57608    ]), Male allosomes
60      , -212.824    , array([ 0.0846838  ,  0.202228   ,  0.0570429  ,  0.26426    ,  6.57674    ,  0.16394    , -0.0142077  ,  5.57608    ]), Female allosomes
60      , -100.051    , array([ 0.0846838  ,  0.202228   ,  0.0570429  ,  0.26426    ,  6.57674    ,  0.16394    , -0.0142077  ,  5.57608    ]), Male allosomes
90      , -212.181    , array([ 0.0846838  ,  0.299793   ,  0.0570429  ,  0.3321     ,  6.57674    ,  0.16394    , -0.090002   ,  5.57608    ]), Female allosomes
90      , -100.161    , array([ 0.0846838  ,  0.299793   ,  0.0570429  ,  0.3321     ,  6.57674    ,  0.16394    , -0.090002   ,  5.57608    ]), Male allosomes
120     , -211.59     , array([ 0.0846838  ,  0.391626   ,  0.0570429  ,  0.392258   ,  6.57674    ,  0.16394    , -0.169668   ,  5.57608    ]), Female allosomes
120     , -100.238    , array([ 0.0846838  ,  0.391626   ,  0.0570429  ,  0.392258   ,  6.57674    ,  0.16394    , -0.169668   ,  5.57608    ]), Male allosomes
150     , -211.07     , array([ 0.0846838  ,  0.474649   ,  0.0570429  ,  0.441292   ,  6.57674    ,  0.16394    , -0.256652   ,  5.57608    ]), Female allosomes
150     , -100.264    , array([ 0.0846838  ,  0.474649   ,  0.0570429  ,  0.441292   ,  6.57674    ,  0.16394    , -0.256652   ,  5.57608    ]), Male allosomes
180     , -210.594    , array([ 0.0846838  ,  0.548377   ,  0.0570429  ,  0.48489    ,  6.57674    ,  0.16394    , -0.344039   ,  5.57608    ]), Female allosomes
180     , -100.267    , array([ 0.0846838  ,  0.548377   ,  0.0570429  ,  0.48489    ,  6.57674    ,  0.16394    , -0.344039   ,  5.57608    ]), Male allosomes
210     , -210.157    , array([ 0.0846838  ,  0.612357   ,  0.0570429  ,  0.524221   ,  6.57674    ,  0.16394    , -0.429566   ,  5.57608    ]), Female allosomes
210     , -100.256    , array([ 0.0846838  ,  0.612357   ,  0.0570429  ,  0.524221   ,  6.57674    ,  0.16394    , -0.429566   ,  5.57608    ]), Male allosomes
240     , -209.761    , array([ 0.0846838  ,  0.666911   ,  0.0570429  ,  0.558899   ,  6.57674    ,  0.16394    , -0.511916   ,  5.57608    ]), Female allosomes
240     , -100.233    , array([ 0.0846838  ,  0.666911   ,  0.0570429  ,  0.558899   ,  6.57674    ,  0.16394    , -0.511916   ,  5.57608    ]), Male allosomes
270     , -209.399    , array([ 0.0846838  ,  0.71555    ,  0.0570429  ,  0.587448   ,  6.57674    ,  0.16394    , -0.587211   ,  5.57608    ]), Female allosomes
270     , -100.206    , array([ 0.0846838  ,  0.71555    ,  0.0570429  ,  0.587448   ,  6.57674    ,  0.16394    , -0.587211   ,  5.57608    ]), Male allosomes
300     , -209.06     , array([ 0.0846838  ,  0.755367   ,  0.0570429  ,  0.617981   ,  6.57674    ,  0.16394    , -0.655063   ,  5.57608    ]), Female allosomes
300     , -100.191    , array([ 0.0846838  ,  0.755367   ,  0.0570429  ,  0.617981   ,  6.57674    ,  0.16394    , -0.655063   ,  5.57608    ]), Male allosomes
330     , -208.753    , array([ 0.0846838  ,  0.78995    ,  0.0570429  ,  0.645067   ,  6.57674    ,  0.16394    , -0.714605   ,  5.57608    ]), Female allosomes
330     , -100.18     , array([ 0.0846838  ,  0.78995    ,  0.0570429  ,  0.645067   ,  6.57674    ,  0.16394    , -0.714605   ,  5.57608    ]), Male allosomes
360     , -208.469    , array([ 0.0846838  ,  0.818766   ,  0.0570429  ,  0.673567   ,  6.57674    ,  0.16394    , -0.765301   ,  5.57608    ]), Female allosomes
360     , -100.183    , array([ 0.0846838  ,  0.818766   ,  0.0570429  ,  0.673567   ,  6.57674    ,  0.16394    , -0.765301   ,  5.57608    ]), Male allosomes
390     , -208.204    , array([ 0.0846838  ,  0.845137   ,  0.0570429  ,  0.701172   ,  6.57674    ,  0.16394    , -0.80675    ,  5.57608    ]), Female allosomes
390     , -100.199    , array([ 0.0846838  ,  0.845137   ,  0.0570429  ,  0.701172   ,  6.57674    ,  0.16394    , -0.80675    ,  5.57608    ]), Male allosomes
420     , -207.969    , array([ 0.0846838  ,  0.868281   ,  0.0570429  ,  0.726067   ,  6.57674    ,  0.16394    , -0.841578   ,  5.57608    ]), Female allosomes
420     , -100.219    , array([ 0.0846838  ,  0.868281   ,  0.0570429  ,  0.726067   ,  6.57674    ,  0.16394    , -0.841578   ,  5.57608    ]), Male allosomes
450     , -207.757    , array([ 0.0846838  ,  0.88854    ,  0.0570429  ,  0.750499   ,  6.57674    ,  0.16394    , -0.869239   ,  5.57608    ]), Female allosomes
450     , -100.247    , array([ 0.0846838  ,  0.88854    ,  0.0570429  ,  0.750499   ,  6.57674    ,  0.16394    , -0.869239   ,  5.57608    ]), Male allosomes
480     , -207.573    , array([ 0.0846838  ,  0.905021   ,  0.0570429  ,  0.772425   ,  6.57674    ,  0.16394    , -0.893754   ,  5.57608    ]), Female allosomes
480     , -100.271    , array([ 0.0846838  ,  0.905021   ,  0.0570429  ,  0.772425   ,  6.57674    ,  0.16394    , -0.893754   ,  5.57608    ]), Male allosomes
510     , -207.41     , array([ 0.0846838  ,  0.919332   ,  0.0570429  ,  0.793733   ,  6.57674    ,  0.16394    , -0.913345   ,  5.57608    ]), Female allosomes
510     , -100.3      , array([ 0.0846838  ,  0.919332   ,  0.0570429  ,  0.793733   ,  6.57674    ,  0.16394    , -0.913345   ,  5.57608    ]), Male allosomes
540     , -207.272    , array([ 0.0846838  ,  0.93191    ,  0.0570429  ,  0.810874   ,  6.57674    ,  0.16394    , -0.929567   ,  5.57608    ]), Female allosomes
540     , -100.324    , array([ 0.0846838  ,  0.93191    ,  0.0570429  ,  0.810874   ,  6.57674    ,  0.16394    , -0.929567   ,  5.57608    ]), Male allosomes
570     , -207.143    , array([ 0.0846838  ,  0.942372   ,  0.0570429  ,  0.830337   ,  6.57674    ,  0.16394    , -0.942326   ,  5.57608    ]), Female allosomes
570     , -100.357    , array([ 0.0846838  ,  0.942372   ,  0.0570429  ,  0.830337   ,  6.57674    ,  0.16394    , -0.942326   ,  5.57608    ]), Male allosomes
600     , -207.029    , array([ 0.0846838  ,  0.951384   ,  0.0570429  ,  0.848324   ,  6.57674    ,  0.16394    , -0.952769   ,  5.57608    ]), Female allosomes
600     , -100.388    , array([ 0.0846838  ,  0.951384   ,  0.0570429  ,  0.848324   ,  6.57674    ,  0.16394    , -0.952769   ,  5.57608    ]), Male allosomes
630     , -206.927    , array([ 0.0846838  ,  0.959106   ,  0.0570429  ,  0.865997   ,  6.57674    ,  0.16394    , -0.961023   ,  5.57608    ]), Female allosomes
630     , -100.422    , array([ 0.0846838  ,  0.959106   ,  0.0570429  ,  0.865997   ,  6.57674    ,  0.16394    , -0.961023   ,  5.57608    ]), Male allosomes
660     , -206.839    , array([ 0.0846838  ,  0.965542   ,  0.0570429  ,  0.881761   ,  6.57674    ,  0.16394    , -0.967848   ,  5.57608    ]), Female allosomes
660     , -100.452    , array([ 0.0846838  ,  0.965542   ,  0.0570429  ,  0.881761   ,  6.57674    ,  0.16394    , -0.967848   ,  5.57608    ]), Male allosomes
690     , -206.764    , array([ 0.0846838  ,  0.970941   ,  0.0570429  ,  0.895684   ,  6.57674    ,  0.16394    , -0.973599   ,  5.57608    ]), Female allosomes
690     , -100.479    , array([ 0.0846838  ,  0.970941   ,  0.0570429  ,  0.895684   ,  6.57674    ,  0.16394    , -0.973599   ,  5.57608    ]), Male allosomes
720     , -206.697    , array([ 0.0846838  ,  0.975519   ,  0.0570429  ,  0.908449   ,  6.57674    ,  0.16394    , -0.978238   ,  5.57608    ]), Female allosomes
720     , -100.504    , array([ 0.0846838  ,  0.975519   ,  0.0570429  ,  0.908449   ,  6.57674    ,  0.16394    , -0.978238   ,  5.57608    ]), Male allosomes
750     , -206.639    , array([ 0.0846838  ,  0.979522   ,  0.0570429  ,  0.920012   ,  6.57674    ,  0.16394    , -0.981928   ,  5.57608    ]), Female allosomes
750     , -100.527    , array([ 0.0846838  ,  0.979522   ,  0.0570429  ,  0.920012   ,  6.57674    ,  0.16394    , -0.981928   ,  5.57608    ]), Male allosomes
780     , -206.59     , array([ 0.0846838  ,  0.982831   ,  0.0570429  ,  0.930013   ,  6.57674    ,  0.16394    , -0.985087   ,  5.57608    ]), Female allosomes
780     , -100.548    , array([ 0.0846838  ,  0.982831   ,  0.0570429  ,  0.930013   ,  6.57674    ,  0.16394    , -0.985087   ,  5.57608    ]), Male allosomes
810     , -206.58     , array([ 0.0846838  ,  0.984578   ,  0.0570429  ,  0.934908   ,  6.57674    ,  0.16394    , -0.986673   ,  5.57608    ]), Female allosomes
810     , -100.536    , array([ 0.0846838  ,  0.984578   ,  0.0570429  ,  0.934908   ,  6.57674    ,  0.16394    , -0.986673   ,  5.57608    ]), Male allosomes
840     , -206.558    , array([ 0.0846838  ,  0.985955   ,  0.0570429  ,  0.939551   ,  6.57674    ,  0.16394    , -0.987774   ,  5.57608    ]), Female allosomes
840     , -100.547    , array([ 0.0846838  ,  0.985955   ,  0.0570429  ,  0.939551   ,  6.57674    ,  0.16394    , -0.987774   ,  5.57608    ]), Male allosomes
870     , -206.537    , array([ 0.0846838  ,  0.987167   ,  0.0570429  ,  0.943995   ,  6.57674    ,  0.16394    , -0.98879    ,  5.57608    ]), Female allosomes
870     , -100.558    , array([ 0.0846838  ,  0.987167   ,  0.0570429  ,  0.943995   ,  6.57674    ,  0.16394    , -0.98879    ,  5.57608    ]), Male allosomes
900     , -206.518    , array([ 0.0846838  ,  0.988191   ,  0.0570429  ,  0.947967   ,  6.57674    ,  0.16394    , -0.989665   ,  5.57608    ]), Female allosomes
900     , -100.568    , array([ 0.0846838  ,  0.988191   ,  0.0570429  ,  0.947967   ,  6.57674    ,  0.16394    , -0.989665   ,  5.57608    ]), Male allosomes
Optimization completed.
-----------------------
Selecting best parameters from step 2.
Step 2 used allosomal data only. Final likelihood is evaluated on autosomal + allosomal data at the selected optimal parameters.

Final parameters and corresponding likelihood computed on autosomal + allosomal data:
----------------------------------------------------------------------------------------------------------------------------------------
      LogLik |         REUR | REUR_sex_bias |         RNAT | RNAT_sex_bias |           t1 |        REUR2 | REUR2_sex_bias |           t2
----------------------------------------------------------------------------------------------------------------------------------------
     -1098.9 |      0.08468 |        0.9882 |      0.05704 |         0.948 |        6.577 |       0.1639 |        -0.9897 |        5.576
----------------------------------------------------------------------------------------------------------------------------------------
Results saved to : output_two_pulses

{'destination_dir': PosixPath('/home/runner/work/tracts/tracts/docs/source/auto_examples/ASW/output_two_pulses'), 'table_file': PosixPath('/home/runner/work/tracts/tracts/docs/source/auto_examples/ASW/output_two_pulses/ASW_test_output_optimal_parameters.txt')}
import sys
from pathlib import Path

sys.path.append('.')

from tracts.driver import run_tracts

script_path = Path(sys.argv[0]).resolve()

driver_filename = "ASW_two_pulses.yaml"

run_tracts(driver_filename = driver_filename, script_dir = script_path)


# Don't run the code below: for documentation purposes only.
from tracts.doc_utils import prepare_example_outputs_for_docs
prepare_example_outputs_for_docs("output_two_pulses")
Total running time of the script: (6 minutes 13.457 seconds)